Teacher takes classroom discussion, debate online
Santa Monica High School English teacher Jennifer Pust enjoys moderating spirited discussions among students about everything from zero tolerance weapons policies to the British Petroleum oil spill in the Gulf of Mexico.
The debates, which could rage over topics as small as store receipts that waste paper, are all posted on an internet bulletin board.
It’s one way Pust is attempting to harness the love her teenage students have for technology – and using it to help them learn.
But figuring out how to fit texting, e-mail and social networking sites like Facebook and Twitter into a curriculum configured around rigid state standards isn’t easy.
“I see experts confirming the ocean I swim against on a daily basis,” Pust said during a seminar sponsored by the MacArthur Foundation and held in Santa Monica, Calif. last month. The seminr was hosted by The Hechinger Institute on Education and the Media.
Pust was among the researchers, educators and journalists who discussed way youth use technology, and swapped tips and stories about how educators are trying to effectively incorporate it into schools and curriculum.
Like teens nationwide, tech savvy students at Santa Monica High School build poems on Twitter, or play the Scrabble-like game “Words With Friends,’’ on their cell phones during breaks in class —with the person sitting right next to them.
Yet it is their peers who don’t use their devices this way that are the ones Pust worries about.
“I haven’t figured out how to leverage the technology that kids bring to class,” she said at the seminar.
It’s not for lack of trying. In an interview, Pust shared an assignment sheet she gave students detailing a current events project slated for a discussion board on Turnitin.com, a plagiarism-detection site that also includes tools to help teach students how to cite sources and quotes.
The assignment required students to respond once a week to a current event posted by their peers and admonished them to briefly summarize the author’s viewpoint — as well as their views on the issue.
In one series of posts, students discussed a October, 2009 New York Times article headlined “It’s a Fork, It’s a Spoon, It’s a…Weapon?” about zero tolerance weapons policies that led young kids to be suspended for bringing cutlery to school.
“With more and more of these types of situations being caused by zero tolerance weapons policies, the question needs to be asked, are these policies truly necessary and are they doing more good than bad?” asked student Jack Cramer, an 11th grader who posted the article and started the discussion.
The debate sparked commentary from a wide range of students, Pust said, including non-native English speakers and a special needs student.
After conducting the online sessions in the 2009-2010 school year, Pust returned to discussing current events the old fashioned way this year—in class—and was surprised at the difference in participation rates.
“I tried studying current events in a more traditional way this year, and had virtually NO conversation about it at all,” Pust said in an e-mail. “Students submitted their articles and shared what they found, but didn’t really delve into any topics in a way that made it meaningful.”
She said that she plans to return to an online forum—where some students are more comfortable expressing their thinking than they are in face-to-face encounters—next year.
Pust added that she also plans to spend some time this summer figuring out how to incorporate technologies her students refuse to be separated from—particularly cell phones—in the coming school year.
The veteran educator has ideas that range from using phones to look up facts and comparing search results to viewing videos or finding background materials that could then be plugged into the computer and overhead projector at the front of the classroom and shared.
One thing she doesn’t yet have is a clear road map for how to get there.
“I don’t want this technology use to be just another gimmick, but to really infuse it into my instruction,” she said.
Special education classifications varied across the country
The number of children assigned to special education nationwide declined last year for the fourth year in a row, according to a new report released this week by the Thomas B. Fordham Institute, but the same wasn’t true in every state. Not only does the percentage of students with an Individualized Education Plan (IEP) – the marker for special education students – vary greatly, 27 states actually identified a higher percentage of students as needing special education services than they had in the previous year.
Pennsylvania led the way with a more than 3 percentage-point increase in classifications, and Texas was at the bottom of the list with a 3 percentage-point decrease. You can see the full breakdown by state on page 11 of the report.
Texas also has, overall, the smallest proportion of special education students in the country, with just over 9 percent of its students having that classification. Report authors Janie Scull and Amber Winkler offer up several explanations for this: Students with dyslexia are not always given IEPs in Texas (state law allows for them to be served through a different type of education plan); the state doesn’t use the federal “developmental delay” category for young children; and Texas has a strong early reading program which could help prevent some specific learning disorder diagnoses.
The report is the first in a series by the Fordham Institute to delve deeper into special education in the country. It sets the stage for future work, breaking down special education classifications by category and state, and analyzing the ratio of special education students to paraprofessionals.
For-profits and charters growing, private schools declining, report says
New education statistics were unveiled Thursday that show big changes in for-profit education, charter schools and more.
Each year, the National Center for Education Statistics releases a report on the state of education that includes tons of new data.
Some of the stories emerging from the report:
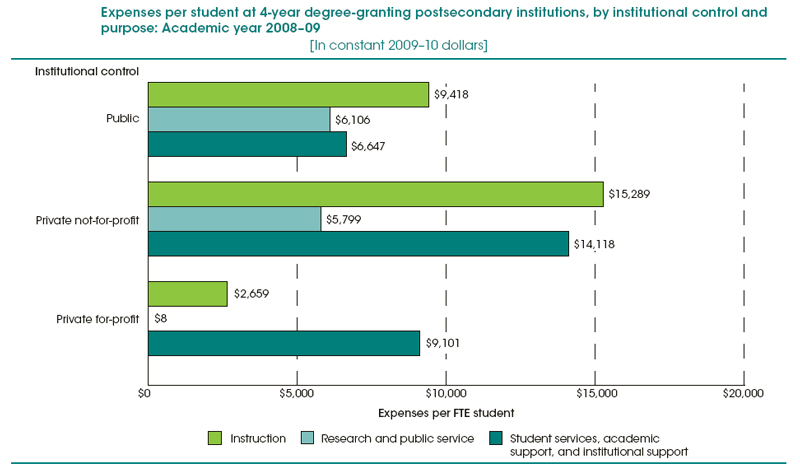
For-profit colleges spend less than a third of what public colleges do on teaching students, even though they charge higher tuition on average than public colleges. For-profits actually spend more on student services and administration than public colleges, but spend almost nothing on research or public service, according to the report.
Not surprisingly, for-profit colleges have been booming in the last decade. Since 2000, for-profits have gone from enrolling 3 percent of all undergrads in the country to 9 percent.
Charter schools have also made a rapid ascent, going from 340,000 students to more than 1.4 million in 2009. Those numbers are likely to keep climbing, with many states planning to expand the number of charters.
The news wasn’t as good for private schools, which have declined in the past decade from enrolling 6.3 million students in 2002 to 5.5 million in 2010, according to the report. Most of that drop comes from declining enrollments at and closures of Catholic parish and diocese schools, according to Education Week.
Read the full report.
Which college degree pays the best money?
The value of a college degree is once again the subject of a study, this time by Georgetown University’s Center on Education and the Workforce, which recently released its report.
This is at least the fourth study/survey on the broader issue of degrees released in the last couple of months. HechingerEd wrapped up the findings of the first three in a post last week.
Unlike the previous surveys/study, the Center on Education and the Workforce research focused mainly on the difference in earnings among people who earn various degrees. But it also appears to lay to rest the question of whether a college degree – specifically, a bachelor’s degree – is worth it financially.
According to the study, a person with a bachelor’s degree earns, on average, 84 percent more than a person with just a high school diploma.
But the college payoff can be even higher, if you choose the right degree, the study finds.
The study looked at 171 different degrees and what graduates earned, using new data from the United States Census. The results show the difference between the highest- and lowest-paying degrees can be more than 300 percent.
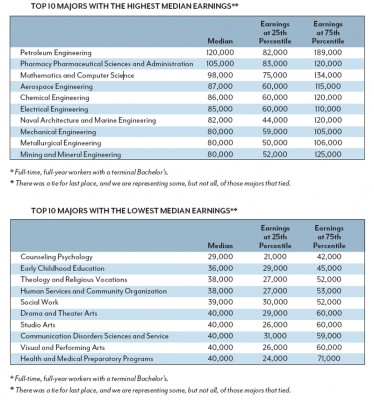 Not surprisingly, the list of the highest-earning degrees is jam-packed with engineering and computer science degrees. In fact, just one of the top degrees – pharmacy pharmaceutical sciences and administration — wasn’t related to those two fields.
The list of lowest-paying degrees is a bit more varied, and includes education, arts and psychology degrees.
Other notable findings:
- If you are looking for a degree that is “recession-proof,” you might consider geological and geophysical engineering, military technology, pharmacology and school counseling. There is virtually zero unemployment among people holding those degrees, the study found. Degrees with the highest unemployment levels include social psychology, nuclear engineering and education administration and supervision, according to the study.
- Women earned less than men in virtually all majors. There were just three degrees where they out-earned men (information services, physiology and visual and performing arts), although for many of the degrees the sample size was too small for comparison.
- Women earn most of the degrees awarded in education (77 percent), psychology and social work (74 percent) and health-related majors (85 percent). They have made gains in the percentage of those earning both math (44 percent) and biology (57 percent) degrees.
- The study includes the highest-paying degrees for various racial groups, including whites (petroleum engineering), blacks (electrical engineering), Hispanics (mechanical engineering) and Asians (pharmacy pharmaceutical sciences and administration).
Read the full report (pdf).
More time in the classroom doesn’t always mean better scores
Our recent post on the long school days that some Chinese students put in got me wondering what kind of connection there might be between lots of classroom time and student performance on an international level. After all, Chinese students scored remarkably high on the latest PISA test.
Turns out there really isn’t an ironclad connection, as the graphic below shows. Certainly students in some countries with lots of instructional time perform well, but students in other top-ranking nations, like Finland, are able to post high scores with much less classroom time. And students in countries like the U.S. can put in lots of class time and still get average scores.
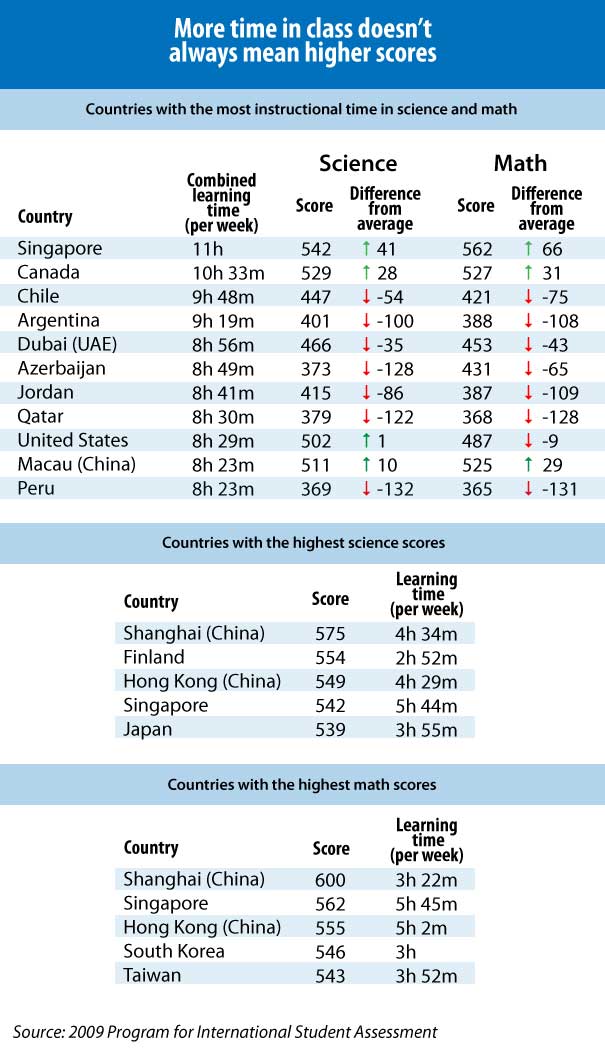
Is college a good investment?
The value and cost of a college diploma have been popular subjects in the last few months. No less than three surveys/studies have been released that look at the issue.
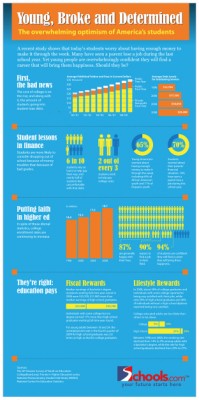
The Associated Press and Viacom teamed up to do a phone survey of 18-24-year-olds for their thoughts on higher education. The survey showed they are worried about the college costs and are having to work to pay for college — but they are overwhelmingly optimistic about their futures.
Schools.com then whipped up this nice infographic that lays out the highlights.
Who Wins? Who Pays? The Economic Returns and Costs of a Bachelor’s Degree
Do college degrees pay off for students? Taxpayers? That’s what the American Institutes for Research set out to discover. The research organization pored over publicly available numbers and came up with some answers.
Community College Spotlight blogger Joanne Jacobs summed up their findings: “Bachelor’s degree holders get a good return on their investment. But taxpayers can be losers.”
Is College Worth It?
The Pew Research Center and the Chronicle of Higher Education teamed up for phone and online surveys that looked at whether a college education is worth the cost.
Like the AP-Viacom survey, the results indicate some doubts about the cost-effectiveness of college, but still a vast majority seemed to think it was a good investment.
According to the Pew/Chronicle surveys, more than half — 57 percent, to be precise — of people rated college either a “poor” or “only fair” value. But among the same people, 86 percent said they felt their college degree was a good investment, and 94 percent of parents said they expect their children to attend college.
The report is also loaded with great information on college-going rates, college costs, student debt and more.
Of bosses, both good and bad
“All good bosses are alike; each bad boss is bad in his own way.”
Tolstoy this isn’t. Nonetheless, it serves reasonably well as a distillation of recent research on leadership. Good bosses tend to do a lot of the same things: trust, respect, protect and empower their underlings; treat people equally (and well); communicate clearly; listen carefully; and provide useful, timely feedback.
Bad bosses, meanwhile, can be bad in countless ways. They might have bad hygiene, or they might intrude on your personal space. They might come late and leave early every day, expecting others to get the real work done — but also expecting to take credit for others’ accomplishments and awards. They likely excel at indecision — or at deciding, but then changing their minds without rhyme or reason.
More dangerously, they might not have a clue what they’re doing (or why), simply because they were promoted to the point of their own incompetence — à la the Peter Principle.
Bad bosses are sometimes pyromaniacs (literally, figuratively, or both), managers who make “every little problem a three-alarm fire.” Patricia Gray detailed a “workplace pyro” she called “Cruella,” who reminds me of bosses I’ve known over the years: “Her direct reports were young, bright, ambitious, eager to please. But she never trusted them to execute on their own. Every project became a crisis, every meeting a fire drill. She would make assignments at night and on weekends. When she was out visiting clients, she kept the team jumping via e-mails — each one marked URGENT, including the one about the typo in the footnote of a routine report. ‘I drove everyone crazy, and I didn’t even realize it half the time,’ she says.”
This is a key feature of many bad bosses: they don’t know they’re bad. In fact, they think they’re good, and they think their underlings universally adore them. As Stanford professor Bob Sutton has written, in Good Boss, Bad Boss (2010), “People in power tend to become self-centered and oblivious to what their followers need, do, and say.”
They have no idea how others view them. It is for this reason that Sutton suggests every boss offer a so-called “bosshole bounty”: $20 to any employee willing to tell the boss he’s been a “jerk.” Most bosses, of course, wouldn’t dream of inviting — let alone paying for! — such criticism. But that’s precisely Sutton’s point: bosses who do so will almost certainly gain new respect from underlings. More importantly, they’ll gain insight into how others perceive them.
What can you do when your boss is so bad you want to quit? (And remember, “people do not quit organizations, they quit bad bosses,” according to Robert Hogan, whom Sutton cites.)
This is a question that Jack Gabarro, an emeritus professor at Harvard Business School, and I recently tackled in an interview on BAM! Radio Network with our host, Holly Elissa Bruno.
Gabarro is well-known for the concept of “managing” one’s boss, which he detailed in a 1980 Harvard Business Review piece co-authored with Harvard’s John Kotter. “Managing your boss” has since become a classic of management literature, having been reprinted in HBR in 1993, 2005 and 2007.
On our radio show, Gabarro said: “If you’re having a problem with your boss, it is seldom all one-sided. … Start off with the premise that you are contributing some percentage of the problem, if for no other reason [than] because you don’t understand who your boss is, what her strengths and weaknesses are, what his style or preferences [are] for receiving information or discussing either problematic or sensitive issues…”
He also stressed the importance of understanding that bosses are human beings with foibles — they’re not infallible. Also, bosses are dependent on their underlings, regardless of whether they realize it.
Gabarro and I agreed that going over your boss’s head to complain about him or her doesn’t often end well, though it may sometimes seem like the only option. To deal with a difficult boss, Gabarro recommends first understanding who your boss is — the context in which he or she lives, and the pressures he or she routinely faces — and then conducting a self-assessment to determine your own strengths and weaknesses. Only then can you sort out the best course of action to take, and you might just realize in the process that you bear some sliver of responsibility for the issues you’re having with your boss.
When it comes to bosses at the school level, we’re talking department heads and principals. As I said on the show, I think the best principals have realized that the way they can be most helpful to teachers is to get out of the way — let teachers teach. Good principals get teachers whatever they need to do their jobs well. If teachers are happy and succeeding — which is to say, if students are learning — everything else follows. But this is a very teacher-centric perspective, I acknowledge, and so it’s important to remind teachers that they serve different constituencies and face different pressures than principals do.
A principal can see his or her chief role as satisfying parents or the district superintendent, but ultimately I think the smarter route is for a principal to look out for his or her teachers first and foremost. This isn’t a popular position these days — given the frequent claims that teachers are overpaid and under-worked — but it does reflect this reality: you can’t have a good school without good teachers. (By contrast, you can have a bad school with a good principal, or a good school with a bad principal. But never will you find a good school with all bad teachers, or a bad school with all good teachers.)
Good teachers are happy teachers — teachers whom their principals trust, respect, protect and empower.
You can listen to the entire radio show here.
How to expand a charter network
The charter-school movement faces a big problem: Advocates want it to keep expanding, but there’s a shortage of effective leaders. Although people have long bemoaned the pool of candidates to lead public schools, the problem has risen in prominence in the charter-school sector.
Indeed, in reporting for a Washington Post article about charter school leadership in Washington, D.C., I heard from a number of experts that the difficulty of recruiting, training and retaining high-quality leaders was one of the biggest threats—if not the biggest threat—to the movement’s ultimate success.
This week, the Center for American Progress released a report, “Preparing for Growth: Human Capital Innovations in Charter Public Schools,” which looks at the strategies used by six charter management organizations, or CMOs, to ensure they have sufficient numbers of high-quality teachers and leaders for continued expansion.
Although in recent years charters have grown by about 400 schools annually, they still make up only about 5 percent of all U.S. schools. And, to be sure, among the 5,000 charter schools nationwide, many are no better—or are actually worse—in terms of student outcomes than their traditional public-school counterparts. A June 2009 study by the Center for Research on Educational Outcomes (CREDO) at Stanford, oft-cited by charter critics, found that only 17 percent of charter schools outperformed traditional schools in their districts. Many charter advocates are therefore careful to say they want to increase the number of “high-quality” charters.
It’s through this lens that the Center for American Progress, a pro-charter organization, looked at Green Dot Public Schools, IDEA Public Schools, High Tech High, KIPP, Rocketship Education, and YES Prep Public Schools, to try and glean some larger lessons.
The report’s authors, Christi Chadwick and Julie Kowal, found three main areas of commonality among the six CMOs. They all had formalized processes through which they recruited, inducted and supported their new hires.
They also “made the most of the people they attract” through additional training and a narrowing of job responsibilities for teachers and principals. (It’s worth noting that one of the struggles for many charter-school leaders is that the job demands not only managing teachers and monitoring student progress, but often other things like fundraising, balancing the budget and recruiting students.)
And finally, the six CMOs all hired teachers prepared through “nontraditional routes,” and they’ve “become adept at choosing teachers with great potential and providing resources and training to help them be successful.”
The report’s authors also urged charter schools to look for charter leaders from outside the sector.
Of course, while strategies like these might serve large charter networks that are resource-rich and have well-developed infrastructures, it’s less clear how useful they’d be for those hoping to open more individual, independent charters. And these schools, in some ways, have greater potential to hold true to one of the original visions for charter schools: to offer experimental ways of educating students in community-based and community-run schools. But as CMOs find more ways to expand rapidly, these independent charters might well become an ever-smaller slice of the sector.
A day in the life of Chinese students
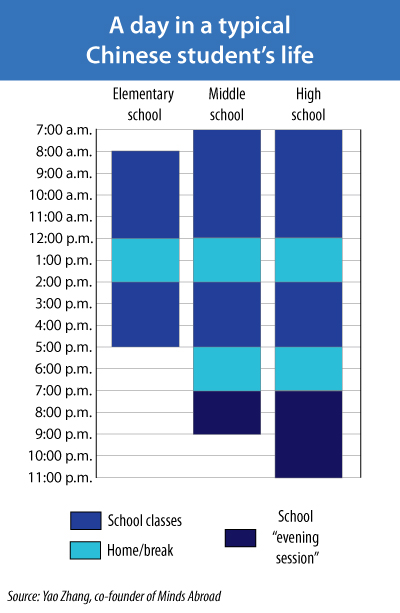
When bemoaning the United States’ comparatively low test scores on international assessments, some are quick to point to one factor that sets Chinese students apart from their American peers: the length of the school day. Unlike in America, where the length of the school day general stays constant from first grade through high school (if not shortening in the final year or two of school), the Chinese public school year grows as students get older. And the competition also increases, said Yao Zhang, a Chinese native who co-founded Minds Abroad, a company that coordinates study-abroad opportunities in rural China. Zhang is completing her Ph.D. in Economics and Education at Columbia University. She recently walked The Hechinger Report through a day in the life of Chinese students at public elementary, middle and high schools.
Elementary school starts at age seven for students in China. In the country’s mega-cities, like Beijing and Shanghai, where transportation is a large factor, students will go to school from 8 am to 3 pm with only a short break for lunch. But in most areas around the country, there’s a break from school for lunch and, often, a lunch-time nap at home. In primary school, students learn Chinese, math, geography and the basics of the natural sciences. English starts in third grade. There are also music, painting and physical-education classes, and one class that translates to “education of thoughts and morality,” Zhang said. This class covers a bit of political science and history, with stories about Chinese heroes.
By middle school, the competitive pressure to get into any high school—not just the top ones—is palpable. Admission is determined almost exclusively by performance on a single test, and only about 70 percent of students who finish middle school go on to high school. Even in primary school, parents start investing money in math Olympiads or musical-instrument training for children whose test-scores might make them borderline candidates for acceptance; extraordinary talent in math or music could be just enough to make the difference. Moving to different neighborhoods to get into better schools is a common strategy, as are hiring private tutors and making $1,000 “donations” to magnet-like middle schools.
And the workload ratchets up in middle school, too. Students spend from 7 am to 8 am at school reading, either in English or Chinese, and reciting to teachers. School ends at 5 pm, but the dinner break is shortened for an hour of “play time”—or physical fitness—beginning at 6 pm. After that, students stay at school for “evening sessions,” which function like study halls or tutoring periods. Students do homework and study, while teachers assist them. Physics, chemistry, biology and political science are tacked on to the elementary school course-load, as well as electives like calligraphy and computer science.
With under 30 percent of high-school graduates getting into college—based entirely on how students do on a “one-shot, one-kill test,” as Zhang put it—most students spend almost all waking hours studying. The subject areas of high-school courses don’t differ much from those in middle school, though phys-ed typically ends after 10th grade. Evening sessions at the high-school level conclude at 11 pm. And, for the many students who attend public boarding schools far from their hometowns, most of their lunch and dinner breaks are spent hitting the books. “Lack of sleep is very common for Chinese high-school students,” Zhang said.
Following the money to the country’s worst schools
 Where are the lowest-performing schools in America? They tend to be in California, Kentucky, Massachusetts, Washington, D.C. and Wisconsin (specifically, Milwaukee) — at least, as judged by where federal money is going.
A federally funded study out this week by researchers at the American Institutes for Research digs into the data on the group of schools eligible for the federal School Improvement Grant program (SIG). These are the “bottom 5 percent” that Education Secretary Arne Duncan has talked about, the ones that are “unsafe, underfunded, poorly run, crumbling, and challenged in so many ways that the situation can feel hopeless,” and for which the Obama administration has allocated $3.5 billion to fix.
Here are some highlights from the report:
- Washington, D.C. had the highest percentage of schools eligible for a school improvement grant, followed by Massachusetts—a school system that many regard as one of the country’s best. It may be that Massachusetts ranked so high because of its tough accountability system, however. (To read the fine-print on what makes schools eligible, see this PowerPoint.)
- Kentucky was the state with the greatest number of schools that actually received money to enact reforms.
- Milwaukee was the city with the most schools—a whopping 46—that received money, nearly double the number in most other districts with high numbers of SIG schools. Philadelphia was second with 27. Jefferson County, Ky., which encompasses Louisville, had 26.
- California got the most money: $415 million.
- Charter schools were overrepresented on the list of failing schools: although they make up only 4.7 percent of U.S. schools, 6.3 percent were eligible. (In the end, 5.5 percent of those receiving SIG grants were charters.)
The total number of schools eligible for the grants numbered 15,277, about 2,000 more schools than the federal government had previously estimated. That’s 16 percent of all U.S. schools—a much higher figure than the “bottom 5 percent” policymakers frequently mention.
Eligible schools are—not surprisingly—more likely to be high-poverty, high-minority, urban schools, a combination that has traditionally been very challenging for educators. Seventy-three percent of the “worst of the worst”—known as Tier I, in SIG parlance—are high-poverty schools.
Only 1,223 schools have received federal money so far; there will be a second round this summer. On average, the lowest-performing schools (Tier I) received $2.6 million, or about $1,490 per pupil.
Schools had four reform models from which to choose, and the report breaks down which ones were selected. Only 2 percent of schools that received SIG money were shut down. Four percent were “restarted” as charter schools, 20 percent agreed to fire their principal and at least half of their teachers, and 74 percent went with the less dramatic “transformation” model, which includes firing the principal and other interventions such as extending the school day.
And, confirming a previous analysis here at Hechinger, high schools are disproportionately represented among schools that won federal money for reform. Although 20 percent of schools in United States are high schools, and only 19 percent of schools eligible for SIG grants are high schools, 40 percent of schools actually awarded SIG money are high schools. The Obama administration purposefully emphasized the upper grades, which in the past have received less federal money.
Additionally, schools in which minorities are the majority were overrepresented among SIG-eligible schools. Although schools that were eligible for grants tended to have higher percentages of Hispanic students, the schools that actually won the grants had higher percentages of African-American students.
The report has more information on how SIG schools were chosen and how their progress will be monitored, both of which vary by state.


